It's a polluted place and they say it's getting more polluted
How air quality is affecting disability in older adults

Top of the morning, sapien. Welcome to Common Sense Medicine, where I try and keep you up to date on the latest and greatest in longevity science.
Sadly, I’m waving goodbye to the PHUL (Power Hypertrophy Upper Lower) program. Sad to see it go, but honestly, wasn’t too great of a workout program. I also had a lot of interruptions on the program between taking a week off to go camping and hiking and another week off on an international trip. Also, I was on a perpetual cut / maintain phase, so wasn’t really great for keeping the strength gains that I had made.
However, lots to look forward to in the next quarter because we’re #BULKING, baby. The hypertrophy journey begins! I’ve created a chart to keep me on track and see if I need to tweak the calories that I’m consuming week over week. I’ll include it in the next few issues to keep me on track. We’re focusing on eating 2.9K to 3K calories per day, and will adjust as we see how my body responds to the training stimulus.
This is the last issue of this year, so not really going to share any “New Years’ Resolutions,” not that I believe in those too heavily. Rather, I focus on quarterly goals (see the last issue’s intro). I think for the next quarter, definitely have a few more experiments to try to see how I can improve the newsletter:
Bridging out to video content: I want to be more active in pushing my work onto other platforms, so I’m going to focus my energy back on YouTube with my newfound interest in training and longevity science. Hopefully I can mimic a similar, sustainable publishing schedule on YouTube that I have on Substack.
Building a better distribution channel. I’ve been reading about how to grow a newsletter and I think that while this newsletter has good branding, it definitely could do better. I want to build out a better landing page so that people can get the value prop in one sentence. Perhaps that means posting more of these on Twitter so I can find people who’d like to subscribe. Or YouTube.

THE WEEKLY DOSE
Air pollution causes higher levels of disability in older age

While the year is closing down, in this issue of the newsletter, I’m focused on air pollution. It’s not a sexy topic, for sure, but I think it’s an important one because the place you live might have a more latent and insidious impact on how you’re living. It’s pretty imperceptible, but the air quality can affect how you are feeling.
When I went to Japan, I thought (very subjectively) that the air seemed a little bit “cleaner” than New York, even though I was walking in the giant metropolises of Tokyo & Kyoto. I was curious to see whether there was anything written about this in the literature about the link between air pollution and overall health. I’ve been told that I have exercise-induced asthma in the past, so I was doubly curious to see whether the pollution which I have been inhaling in a big city and big-city-adjacent life will affect me later in life and what I can do about it.
Gao et al. had the same thought, and they were able to look at a cohort of over 15,000 adults who were 65 and older to see if there was any correlation between physical disability and air pollution.1 In this newsletter, I dive deeper into the link between disability and air pollution, focusing particularly on how it affects running and performance.
How is air pollution measured, anyway?
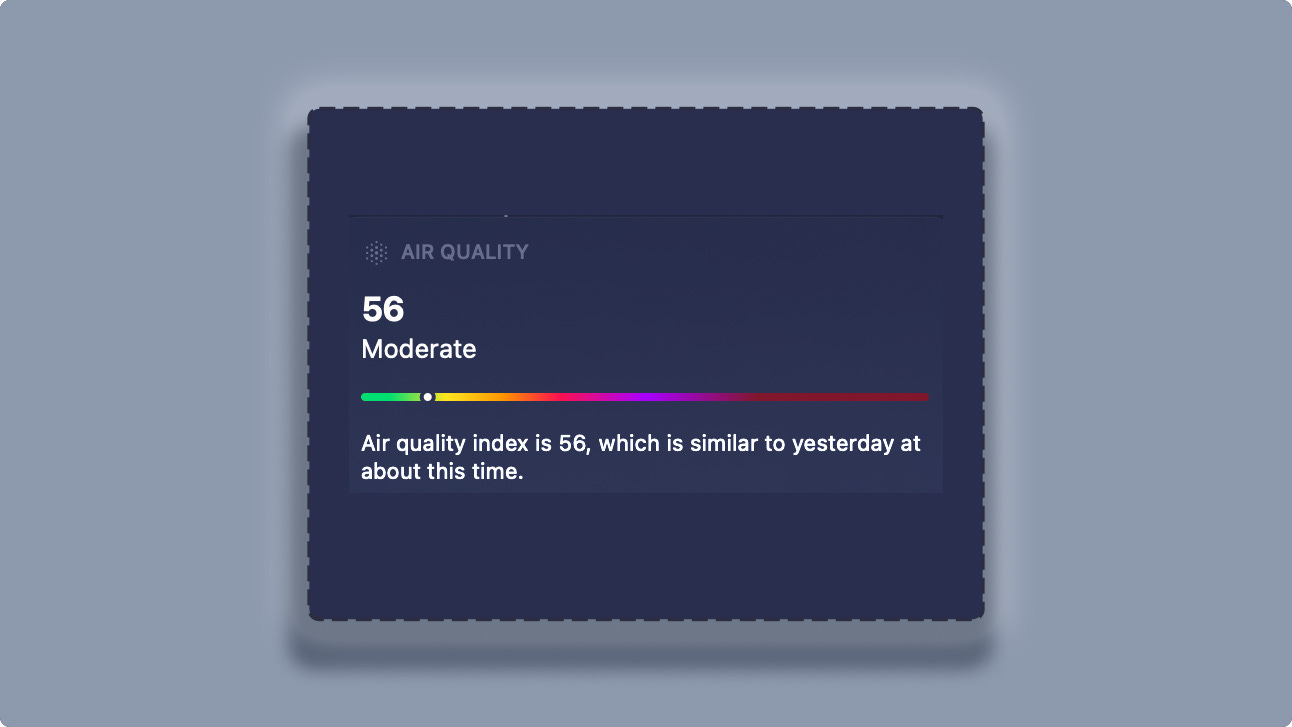
Air pollution is largely measured using observational studies, focused on people remembering their symptoms associated with the weather and marking it down. If you check your Apple Weather forecast, you can actually see the air quality index (AQI) highlighted underneath the temperature. There have been multiple studies which focus on the air quality based on the PM2.5 index, particles in the air which are 2.5 micrometers or less in diameter which can cause heart & lung disease, respiratory symptoms, and a host of other bad stuff (See here for more). These studies use not only questionnaires, but with the advent of new technologies, they can use the rate of usage of smart inhalers, smartphone data, and company proprietary sensing (i.e., Aclima) to show how air quality gets better in certain areas or at nighttime.
Indoor air quality is trickier to measure, but subjectively you can feel the difference when you go outside to get some “fresh air” vs. inside. There hasn’t been any large scale randomized or observational data on how indoor air quality can differ across different settings, but there is some research to prove that stale air is making us less productive.
For this study, they measured pollution based on the concentration of PM2.5, but specifically focused on a country with a low-pollution setting (USA) and quantified association between air pollution and physical disability across several air pollutants. They went deeper than this as well, focusing on how each pollutant—fine (<2.5 µm), coarse (2.5-10 µm), NO2, and O3—affects disability in older adults (>65). Their data came specifically from the Health and Retirement Study (HRS), which is an open cohort study in the changes that happens with aging in adults in the USA.
Adults in the study were asked on a 2-year interval with various demographic and lifestyle questions, and physical disability was based on activities of daily living (ADLs): dressing, walking across a room, bathing, eating, getting in and out of bed, and toileting. They adjusted for socioeconomic variables, sex, race, ethnicity, and the measure of ‘urbanicity’ (i.e., metro, suburban, rural, undefined) and place (i.e., north, south, east, west of US) of their residence. They also adjusted for the mode of the interview which was conducted for the data (verbal / written) because it can affect the results of how disabled a person is and might confound the conclusions of the study.
Total pollution is the problem, not any single pollutant
The investigators observed that higher rates of pollutants can cause higher rates of disability (shocker shocker!), but only the PM2.5 causes significantly higher rates of disability as reported by ADLs. They showed that when adjusting for other co-pollutants and also the covariates which I had mentioned in the previous section, there wasn’t really one pollutant which stuck out as the ‘cause’ of disability. Also, they showed that on the whole, there’s different types of pollutants in various parts of the US—the southwest has less of PM2.5 but has a propensity for O3 and PM10-2.5, and vice versa for the northeast. Guess I’m a PM2.5 guy after all (bad news for my asthma).

A higher PM10-2.5 showed an independent 5% increase in mortality though, so sucks to move to Phoenix, Arizona and breathe all that air in (see the 1.05 HR for PM10-2.5 in the figure above). The authors posit that the reason that PM10-2.5 might have a bigger impact on the ADLs is because it lodges in our upper respiratory tract, causing more disability than the PM2.5. One interesting finding is that Ozone seems to have a statistically insignificant but still striking protective factor for folks.
Does this mean I’m finding a nice bottle of Ozone to breathe in? Not quite — I think this effect is evident because there’s probably other things in the northeast that I’m breathing in which is worse for me than those in the southwest. I guess it’s a little bit of you give and you take.
Remember to check the AQI when you’re checking the weather, too
There are limitations of this study, largely because the selection of the participants is focused on those who volunteer for the study and may be healthier than people who have already declined and can’t answer questions in written or verbal format. I don’t think people who have already declined in ADLs are answering questions about their habits. But, they did have an average response rate of 85-90%, which showed (to me anyway) that there is merit to looking at these individuals.
This study isn’t anything to write home about, in the end, because all it shows is that pollutants, on the whole, affect physical disability. I think the larger question here is how to tackle these pollutants in my own life. I’m running in the summer, when air is more ‘hazy’ and I have more trouble getting through my runs. I think the actionable tip from this paper is to take a look at the air quality index on my iPhone before I step out: the northeast is chock-full of PM2.5s, and anything that I can use to monitor how it is outside can help me make the decision on whether I should step out or not.
Okay, well, I think that’s it for this year. I’m glad you stuck around for the ride, and I hope to see you in the New Year. 2025 is going to be chock-full of new posts (and videos hopefully!)

REMEMBER, IT’S JUST COMMON SENSE.
Thanks so much for reading! Let me know what you thought by replying to this email.
See you next week,
Shree (@shree_nadkarni)
The information provided here is not medical advice. This does not constitute a doctor patient relationship and this content is intended for entertainment, informational, and educational purposes only. Always consult with a doctor before starting new supplementation protocols.
Gao J, Leon CFM de, Zhang B, et al. Long-term air pollution exposure and incident physical disability in older US adults: a cohort study. The Lancet Healthy Longevity. 2024;5(10). doi:10.1016/j.lanhl.2024.07.012
Such a powerful post! The perspective shared on pollution and its impact is eye-opening. It's disheartening to think about how polluted places continue to affect communities and ecosystems. Awareness and action are key, and posts like this can inspire change. Thank you for bringing this critical issue to the forefront!
https://www.holyquranclasses.com/skype-quran-classes-online.html
Insightful post! It’s powerful how you connected pollution with real human impact—brief but thought-provoking.
https://www.holyquranclasses.com/memorize-quran-online.html